

Tracking of known problems and subsequent fixes is an important issue for MODIS data users. This page will act as a repository of all known MODIS Atmosphere Data Product problems, as well as how to determine the problematic version (and the fixed version) of the HDF data -- therefore data users should check this page for updates regularly. Data Users unfamiliar with how to properly track problems and fixes by determining the version of their downloaded HDF files should refer to the documentation in the Introduction sublink (the top link along the LHS of this page).
Note that a checkmark (✔) in the tables below means Data Issue or Quality Statement applies. A blank means it's been fixed or does not apply.
Cloud Data Issues: Table of Contents & Anchor Links
(Note: Anchor Links point to a specific place within this page.)
| Collection/Platform where Issues Apply |
| Issue | Impact |
C6.1/Terra |
C6.1/Aqua |
C6.0/Terra |
C6.0/Aqua |
| #1. NISE Ancillary Anomaly |
L |
✔ |
✔ |
✔ |
✔ |
| #2. GDAS Change Impacts |
H |
|
|
✔ |
✔ |
| #3. Missing Cloud Top Data Chunks |
M |
|
✔ |
|
✔ |
| #4. Band 29 Cal Drift (False Clouds) |
H |
|
|
✔ |
|
| #5. Surface Albedo & A.S.L. |
L |
|
|
|
✔ |
| #6. Cloud Optical Thickness Overflow |
L |
|
|
|
✔ |
| #6a. COT & CER valid range local attribute fix |
L |
✔ |
✔ |
✔ |
✔ |
| #7. CT Day Granules misplaced to Night |
L |
✔ |
✔ |
✔ |
✔ |
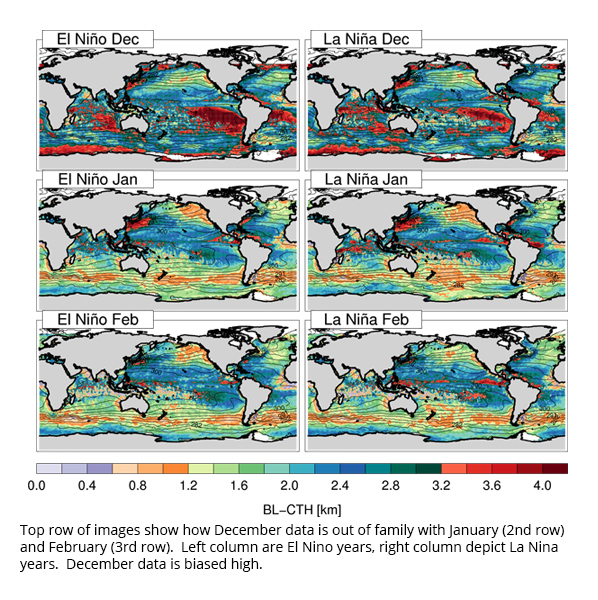
| #8. 1km CTP Low Ocean in December |
M |
|
|
✔ |
✔ |
| #9. Band 27 anomalies impact CldTopProp |
L |
✔ |
|
|
|
| #10. Band 7 striping affects 2000 CldOptProp |
L |
✔ |
|
✔ |
|
| #11. GDAS update causes slight changes |
L |
✔ |
✔ |
|
|
| #12. Missing Data in 5km CTP parameters |
M |
✔ |
✔ |
|
|
| #13. Artificial Trending in IR Cloud Phase |
M |
|
✔ |
|
|
| #14. PWA Failure in Oct 2020 affecting high lats. |
M |
✔ |
|
|
|
| #15. Isolated pixels of Cloud Top Height = 0.0 meters |
L |
✔ |
✔ |
✔ |
✔ |
| #16. Aqua Crosstalk Issue in Apr-Jul 2022 Data |
L |
✔ |
✔ |
|
|
Cloud Data Quality Statements: Table of Contents & Anchor Links (Note: Anchor Links point to a specific place within this page.)
| Collection/Platform where Quality Statements Apply |
| Quality Statement | Impact |
C6.1/Terra |
C6.1/Aqua |
C6.0/Terra |
C6.0/Aqua |
| #1. Discontinuity starting Jul 2016 |
Q |
|
|
|
✔ |
| #2. Missing Granules Aug 2017 |
Q |
✔ |
|
✔ |
|
| #3. 1km vs. 5km Cloud Top Quality |
Q |
✔ |
✔ |
✔ |
✔ |
| #4. 1km vs. 5km IR Phase Quality |
Q |
✔ |
✔ |
✔ |
✔ |
| #5. Start Time of 06_L2 Granules |
Q |
✔ |
✔ |
✔ |
✔ |
Issue #1: NISE (Snow and Ice Cover) Ancillary Input Anomaly
 Description: NISE Snow and Ice Cover Ancillary Data is used by both Cloud Top Properties (CTP) and Cloud Optical Properties (COP), which are both part of the Cloud Product (06_L2). NISE is a 5-day running average snow and sea ice cover (yes/no for snow and a percentage cover for sea ice) from the SSM/I-SSMIS instrument provided by the NSIDC (National Snow and Ice Data Center). The product is output on a polar grid at 20km resolution. If the granule time is before 12:00 UTC, the NISE product from the previous day is used, otherwise the product from the granule's day is used. The data in this product is used in conjunction with the gap-filled surface albedo product and the 1/10 degree broadband surface emissivity product in order to establish the final value of surface albedo or surface emissivity depending on the spectral channel.
A problem was previously identified in NISE where it was under-reporting snow cover over North America, and a bit less so over Northern Europe and Asia. This anomaly in ancillary input cascades through the Cloud Retrieval algorithm and produces anomalous results in a number of Cloud Product parameters. The L2 Cloud Algorithm team has determined that the solution to this issue is to switch this snow and ice ancillary input from NISE to GEOS-5. However, that will not be done "mid-stream" -- so this fix is being held back until a reprocess of the data record is undertaken (Collection 061) sometime during 2017.
March 2017 update on this issue:
The MODIS cloud optical and microphysical properties product (MOD06) uses the NISE ground snow cover extent to determine which channel should be used as the non-absorbing band during retrieval of cloud optical thickness and cloud effective radius. In order to perform a good quality retrieval, we would like the surface to be as dark as possible. When there is snow on the ground, the standard 0.65 micron channel we use over land becomes very bright. However, the 1.2 micron channel remains dark for snow-covered surfaces. For bare ground 0.65 micron channel is better than 1.2 micron. In order to make the choice between 0.65 and 1.2 micron we need to know whether or not there is snow on the ground. The NISE product is used by the operational MOD06 product to make this determination.
Overall the impact of the change appears to be rather minimal. Some places have more snow -- some places have less. The exact map changes day to day and it does not appear that there will be any noticeable impact on mean monthly statistics of retrieved cloud optical thickness or cloud effective radius.
See the PDF document and Movie file linked below for a bit more detail (information and imagery).
NISE Issue Document (PDF)
![]() NISE Issue Movie (MP4)
NISE Issue Movie (MP4)
PGE Versions & Production Dates of Problematic & Corrected Data:
| Problematic Data | Corrected Data | ||
|---|---|---|---|
|
PGE Versions |
Production Dates |
PGE Versions |
Production Dates |
|
≤ PGE06 v6.0.92 |
≤ 2016 334 (11/30/2016) |
≥ PGE06 v6.0.93 |
≥ 2016 335 (12/1/2016) |
Data Dates Affected: 1 December 2016 (Day 335) and forward
Affected Platform: Aqua and Terra
Collections Affected: Collection 6.0 and Collection 6.1
Issue #2: GDAS Change Impacts
 Description: New GDAS data is causing problems in the 1km Cloud Top Properties Algorithm causing bad (Level-2) 1km Cloud Top Properties data, as well as bad (Level-2) 1km Cloud Optical Properties data, to make it into distributed public HDF files starting for data dates in May 2016. For Level-3, the impact is mostly in the Cloud Optical Property SDS's since mostly the 1km COP data is propagated from L2 to L3, however there is one 1km CTP Joint Histogram that is computed in L3, which will be affected. Most of the other CTP SDS's in L3 are not impacted, since most of those are computed from the 5km L2 CTP data. A potential fix for this bad data is still being investigated as of May/June 2016. A fix should eventually be implemented, at which time affected data (data Dates of May 11, 2016 and later) will be rerun (corrected) and made available.
See the (draft) PDF document linked below for a bit more detail (information and imagery).
For more information, view this PDF document:
GDAS Issue Document (PDF)
PGE Versions & Production Dates of Problematic & Corrected Data:
| Problematic Data | Corrected Data | ||
|---|---|---|---|
|
PGE Versions |
Production Dates |
PGE Versions |
Production Dates |
|
≤ v6.0.85 (Aqua) & 6.0.91 (Terra) |
≤ 2016 132 (05/11/2016) |
Corrected in C6.1 |
≥ 2017 271 (9/28/2017) |
Data Dates Affected: 11 May 2016 (Day 132) and forward
Affected Platform: Aqua and Terra
Collections Affected: Collection 6.0
Issue #3: MYD06 (Aqua 5km Cloud Top Properties) Occasional chunks of missing CT data around Southern Africa in a 3 hour time window only (occurring only intermittently).
 Description: In early 2015, it was noticed that very occasionally there were areas of missing Cloud Top Properties (derived from 5km CT L2 ) data in L3 in the area of Southern Africa. This was traced back to the Level-2 5km Cloud Top Properties source data (06_L2). And later was diagnosed as a black body warm-up/cool-down issue that only occurs between 0900 and 1230 UTC. This actually was found to occasionally affect the 5km CT data since Aqua launch in July 2002, however it's been slowly getting worse over time.
Since this only impacts 5km Cloud Top Properties data and not 1km Cloud Top Properties data, the 1km Cloud Optical Properties data is not affected!
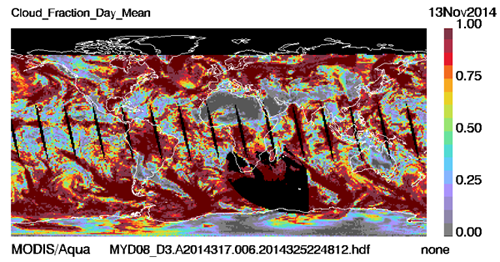
Here is a sample L3 image of Cloud Fraction (from Cloud Mask) for Daytime for 13Nov2014, which shows the missing data issue fairly clearly.
PGE Versions & Production Dates of Problematic & Corrected Data:
| Problematic Data | Corrected Data | ||
|---|---|---|---|
|
PGE Versions |
Production Dates |
PGE Versions |
Production Dates |
|
All |
≥ July 2002 (Since Aqua launch) |
Not Corrected |
Not Corrected |
Data Dates Affected: July 2002 to Current (Since Aqua launch)
Affected Platform: Aqua only
Collections Affected: Collection 6.0 and Collection 6.1
Issue #4: MOD35 (Terra Cloud Mask) False Clouds over Ocean (Impact of the MODIS Terra Band 29 (8.6 µm) radiometric calibration drift on cloud products)
Description: In early 2015, it was noticed that recent Terra Collection 6 (C6) cloud top pressure products (MOD06) contained ocean regions with an anonymously high incidence of low clouds. This was traced to false clouds being reported by the cloud mask (MOD35). In turn, this was found to be the result of errors in the b29-b31 brightness temperature difference (BTD) high (ice phase) cloud test. As a result, a substantial number of clear pixels were being flagged as cloudy by this test. The text that follows is a summary of the impact of the MODIS Terra Band 29 (8.6 µm) radiometric calibration drift on cloud products. MOD35 includes a spectral test using the brightness temperature difference (BTD) between band 29 (8.6 µm) and band 31 (11 µm), referred to here as the b29-b31 BTD test. This test is used only over water surfaces. The root problem is a gradual warming in the Terra MODIS b29 channel over the years, that is not being captured by the on-board calibration systems and apparently related to crosstalk issues. Monthly time series trend analysis of Terra MODIS cloud products indicates that the significance of the impact may extend back to 2010. In lieu of a successful fix to the L1B algorithm for b29, an adjustment to the 8.6-11 µm MOD35 test threshold was delivered to the production test system to quantify the impact. Testing of this potential fix in the data is ongoing as of September 2015. A fix should eventually be implemented, at which time affected data will be rerun (corrected) and made available. See the PDF document linked below for for detailed information and imagery.
MODIS Terra Band 29 (8.6 micron) impact of calibration drift on cloud products (PDF)
PGE Versions & Production Dates of Problematic & Corrected Data:
| Problematic Data | Corrected Data | ||
|---|---|---|---|
|
PGE Versions |
Production Dates |
PGE Versions |
Production Dates |
|
C6.0 (≥ 2010) |
≥ 2010 001 (1/1/2010) |
Corrected in C6.1 |
≥ 2017 271 (9/28/2017) |
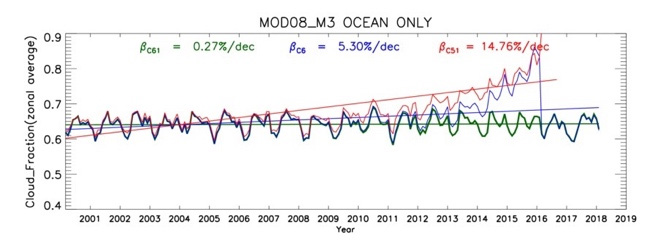
Plot shows the Cloud Fraction (Terra) 18-year time series for the tropical oceans (25N to 25S). Red=C5.1, Blue=C6.0, Green=C6.1
Note that C6.1 data record (green line) has been restored thanks to the reprocessing with the updated/corrected C6.1 MOD02.
Data Dates Affected: January 2010 to present (but worse 2014 and beyond)
Affected Platform: Terra Only
Collections Affected: Collection 6.0 (for data dates of 2010 and beyond)
Issue #5: Four Minor Corrections including updated Surface Albedo and Alternate Solution Logic (ASL)
Description: The following changes entered Aqua forward processing starting on the production date given below. Aqua data generated before the corrected Production Date (noted below) was not reprocessed. Terra was not impacted as Terra processing had not yet begun when the problem was found and fixed.
Surface Spectral Albedo Dataset updated through 2013: The MOD06 ancillary land/snow albedo dataset is an 8-day cadence (16-day average) gap-filled dataset derived from the Collection 5 MOD43 product. With a recent update of the ancillary dataset through 2013, MODAPS is reprocessing all 2013 MOD06 cloud optical property datasets for C6 Aqua. In addition, forward processing (2014 and onward) will use the albedo dataset from the corresponding 2013 time period. This was found to have minor impact on cloud optical retrievals for a monthly aggregation from a test version of the MODIS Atmosphere Level-3 product. (Data Impact from this item was of minor consequence)
Alternate Solution Logic (ASL) algorithm: Instances occur when the retrieved cloud optical thickness is > 150 and the shortwave infrared (SWIR) or mid-wave infrared (MWIR) channel reflectance is within the valid look-up table (LUT) solution space for cloud effective radii (CER) retrievals. For such pixels, the previous ASL CER solution interpolation routine occasionally defaulted to the closest LUT grid point CER integer value instead of interpolating between the two adjacent LUT grid points. This update now provides interpolated CER. This minor issue generally only occurs at high latitudes and large solar zenith angles. (Data Impact from this item was of minor consequence)
Cloud Optical Thickness (1.6 and 3.7 micron retrievals) capped at 150: A bug fix was implemented to fix a few Cloud Optical Thickness 16 & 37 Retrievals that were beyond the 150 maximum. This was happening for a small number of very bright clouds (typically at low sun angles. In this new version, all valid COT retrievals fall in the 0 to 150 range. (Data Impact from this item was of minor consequence)
New Scattering Parameter SDS attribute: To improve documentation for Cloud Product (06_L2) data users, local attributes have been added to the 2-dimensional Scattering Property SDSs to provide the MODIS channels and cloud effective radii corresponding to the rows and columns of the datasets. The modified SDSs and their dimensions follow.
- Liquid Water Cloud LUT Scattering Parameter SDSs (7 channels x 18 effective radii):
1.) Asymmetry_Parameter_Liq, 2.) Single_Scatter_Albedo_ Liq, 3.) Extinction_Efficiency_Liq
- Ice Cloud LUT Scattering Parameter SDSs (7 channels x 12 effective radii):
1.) Asymmetry_Parameter_Ice, 2.) Single_Scatter_Albedo_Ice, 3.) Extinction_Efficiency_Ice
PGE Versions & Production Dates of Problematic & Corrected Data:
| Problematic Data | Corrected Data | ||
|---|---|---|---|
|
PGE Versions |
Production Dates |
PGE Versions |
Production Dates |
|
≤ PGE06 v6.0.79 |
≤ 2014 258 (9/15/2014) |
≥ PGE06 v6.0.80 |
≥ 2014 259 (9/16/2014) |
Data Dates Affected: January 2013 to April 2014
Affected Platform: Aqua Only
Collections Affected: Collection 6.0
Issue #6: Cloud Optical Thickness (1.6 and 3.7 micron retrieval) Overflow
Description: A few Cloud Optical Thickness 16 & 37 Retrievals are outside the expected valid range of 0 to 150. The intended maximum reported value for a successful Cloud Optical Thickness (COT) retrieval was increased from 100 in Collection 5 to 150 in Collection 6 (C6). However the new C6 COT datasets Cloud_Optical_Thickness_16 and Cloud_Optical_Thickness_37 were inadvertently not limited to 150. Therefore, for a small number of very bright clouds (typically at low sun angles), these two COT datasets can exceed 150 or become negative due to an integer overflow (beyond a COT value of 327.67, which corresponds to a packed short integer value of 32767 (the largest I*2 value that can be stored)). Users are advised that if they encounter a COT value in these datasets that is either greater than 150, or less than 0 but not a fill value, then the value should be set back to 150. This minor COT dataset issue has been remedied for Aqua forward processing starting on "Data Date" January 1, 2013 (with an HDF File "Production Date" of 2014 111 or later). Since the problem was found before C6 Terra processing began, no C6 Terra data was impacted.
PGE Versions & Production Dates of Problematic & Corrected Data:
| Problematic Data | Corrected Data | ||
|---|---|---|---|
|
PGE Versions |
Production Dates |
PGE Versions |
Production Dates |
|
≤ PGE06 v6.0.73 |
≤ 2014 110 (4/20/2014) |
≥ PGE06 v6.0.74 |
≥ 2014 111 (4/21/2014) |
Data Dates Affected: July 2002 to December 2012
Affected Platform: Aqua Only
Collections Affected: Collection 6.0
Issue #6a: COT & CER valid range local attribute fix
Description: In Collection 6 the valid range of data for Cloud Optical Thickness (COT) and Cloud Effective Radius (CER) was changed from prevous ranges set in Collection 5.1 and earlier. However the valid_range local attribute was not changed at this same point in time. Therefore, all the the Collection 6.0 record and part of the Collection 6.1 record has incorrect valid_range local attribute settings. This was corrected in the forward stream of Collection 6.1 starting in early 2019.
PGE Versions & Production Dates of Problematic & Corrected Data:
| Problematic Data | Corrected Data | ||
|---|---|---|---|
|
PGE Versions |
Production Dates |
PGE Versions |
Production Dates |
|
≤ PGE06 v6.0.4 |
≤ 2019 015 (1/15/2019) |
≥ PGE06 v6.0.5 |
≥ 2019 015 (1/15/2019) |
Data Dates Affected: March 2000 to January 2019
Affected Platform: Terra & Aqua
Collections Affected: Collection 6.0 & 6.1
Issue #7: Very Intermittently occurring Cloud Top Property Granules misplaced from Daytime to Nighttime
Description: Very occasionally, a few daytime granules are misplaced to the nighttime SDS's in 06_L2. This misplacement seems to be correlated with satellite maneuvers which occur for very brief periods (minutes) on a one to two month schedule. This problem is isolated to any 06_L2 SDS which has the suffix "_Day" or "_Night" (which corresponds to a few Cloud Top Property parameters). The upshot is for users reading any _Day SDS in L2, there will be a few isolated missing granules, and any user reading any _Night SDS in L2, there could be a few cases where day granules are overlapping the night granules. This is occurring in less than 0.001% of the time. To bypass this issue, users can read the un-aggregated L2 SDS's and do the D/N aggregation using the Cloud Mask D/N Flag if needed.
PGE Versions & Production Dates of Problematic & Corrected Data:
Data Dates Affected: Can occur anytime, but very intermittent and very limited in scope
Affected Platform: Aqua and Terra
Collections Affected: All Collections
Additional Documentation: View PDF (shows how this L2 error impact L3)
![]()
Issue #8: Problem in C6.0 1-km Cloud Top Property (Low) over Ocean in December
Description: A bug was discovered in the Collection 6.0 1-km Cloud Top Property Low (retrievals > 600 hPa) algorithm over ocean for both Terra and Aqua. Cloud Top Property Low retrievals for all oceanic L2 December data are biased high when compared to other months and are considered to be incorrect. The impact will also be seen in daily, 8-day, and monthly L3 data, where 1km CTP data is ingested (which is only in two L3 joint histograms that compare 5-km averaged with 1-km sampled CTP data). Note that this issue was corrected in Collection 6.1 data.
PGE Versions & Production Dates of Problematic Data:
Data Dates Affected: Decembers from launch through 2016
Affected Platform: Aqua and Terra
Collections Affected: Collection 6.0 only
Additional Documentation:
Issue #9: Occasional Band 27 Anomalies impact Cloud Top Property Parameters
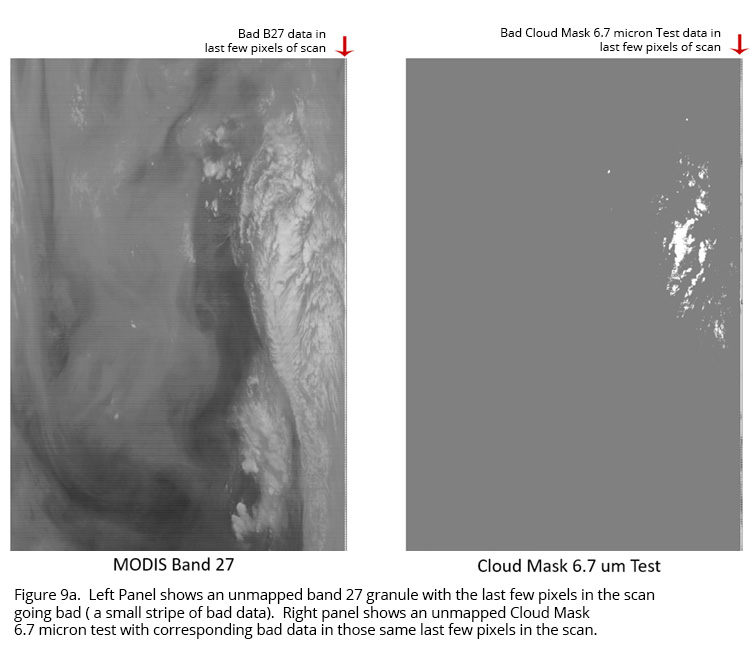
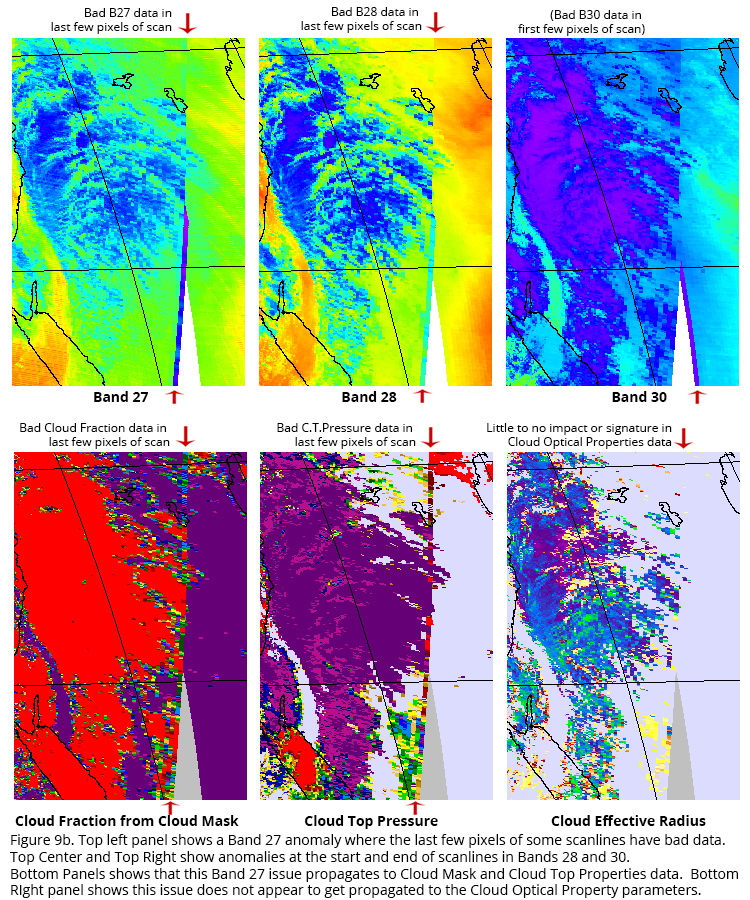
Description: An anomaly was noted sometime after the calibration change of Terra C6.1 (noted by Chris Moeller, UW). The cloud mask uses band 27 in a high cloud test that inadvertently flags many of the pixels at the end of scan (1349-1354) as being cloudy because of anomalous BTs. (Note that intermittent edge-of-scan anomalies in Band 28 and Band 30 have also been recently noted. The anomalies in Band 28 match the location of anomalies in Band 27; however in band 30 the anomalies seem to switch to the first few pixels at the beginning of a scan 1-5 instead of at the end of a scan 1349-1354). This band 27 issue propagates into the Cloud Mask and then into the Cloud Fraction from Cloud Mask and then into many Cloud Top Property parameters in L2. Its difficult to see in L3 due to coarser resolution and orbit overlap. It does not appear that this issue propagates into Cloud Optical Property parameters at L2. Figure 9a below shows an unmapped granule image of b27 BTs and the b27 cloud mask test. Figure 9b shows mapped impacts in downstream Cloud Top Property products (Date Imaged 2018 148).
PGE Versions & Production Dates of Problematic Data:
Data Dates Affected: Shows up intermittently in all time periods (from launch)
Affected Platform: Terra
Collections Affected: Collection 6.1 only (Cloud Mask and Cloud Top Property parameters at L2)
Additional Documentation:
Issue #10: Intermittent Terra Bands 6 and 7 striping occasionally impacts Cloud Optical Property parameters in year 2000
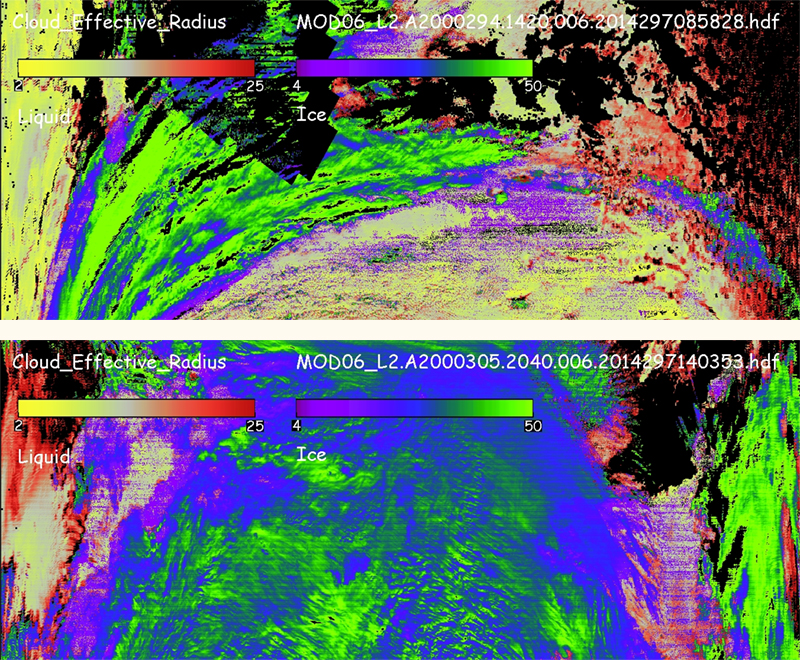
Description: Some intermittent radiometric striping is occurring in Bands 6 (1.6µm) and 7 (2.13µm) for Terra data during the year 2000 (data year), particularly days 294 and 305, with impacts on downstream Cloud Optical Property products including Cloud Optical Properties Phase and Cloud Effective Radius. This is not surprising given the known calibration issues that occurred during A-side/B-side changes at that time. Visualization of Cloud Effective Radius from the 2.13µm band, shown for two L2 granules below, illustrates the impact on both the effective radius and phase retrievals. Little to no effect was detected in the L2 Cloud Mask data. This striping does not appear to propagate to L3, however, due to detector sampling.
PGE Versions & Production Dates of Problematic Data:
Data Dates Affected: Appears intermittently in year 2000 Terra data and is (at least) evident occurring in certain granules between days 275 and 325. The extent of this could extend further backward and forward in time but is likely isolated in year 2000.
Affected Platform: Terra
Collections Affected: Both Collection 6.0 and 6.1 (Cloud Optical Property parameters at L2)
Additional Documentation: Examples of the Impact of Band 7 striping on Cloud Effective Radius for 2000294 and 2000305
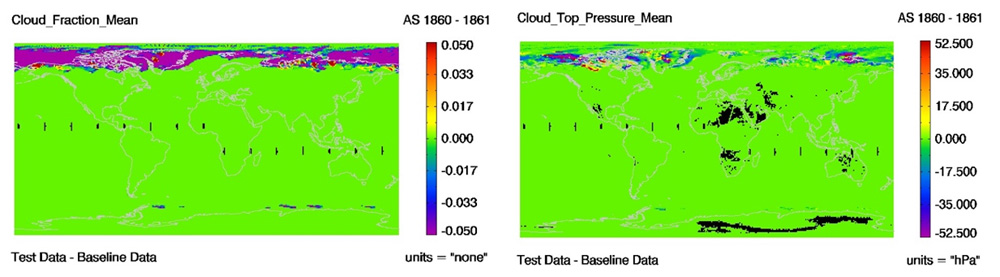
Issue #11: New GDAS for data processed 12 June 2019 and forward
Description: A change has been made to the GDAS (Global Data Assimilation System) atmospheric profiles of temperature, moisture, and ozone profiles that are used as ancillary data in the cloud top properties algorithms (5-km and 1-km MOD06CT and MYD06CT products). The greatest impact to these products is seen in polar regions where many cloud top heights are raised (cloud top pressures lowered). A decrease is seen in the number of cloud height retrievals at surface levels due to errors in temperature profiles and uncertainties in the algorithms. Changes in other parts of the world appear to be random and mostly less than 50 hPa. It's interesting to note that the changes are larger in the Cloud Top Pressure (CTP) vs. those seen in the Cloud Top Temperature (CTT). The theory behind this is we are getting the same or similar cloud top temperatures from, e.g., an 11µm brightness temperature retrieval, but the conversion to pressure using the ancillary profiles might be more different.
The MODIS cloud masks (MOD35 and MYD35) are minimally impacted through changes to the GDAS surface temperature. These cloud detection changes are small, random in nature, and are confined almost completely to nighttime data where surface temperatures are important for warmer surfaces.
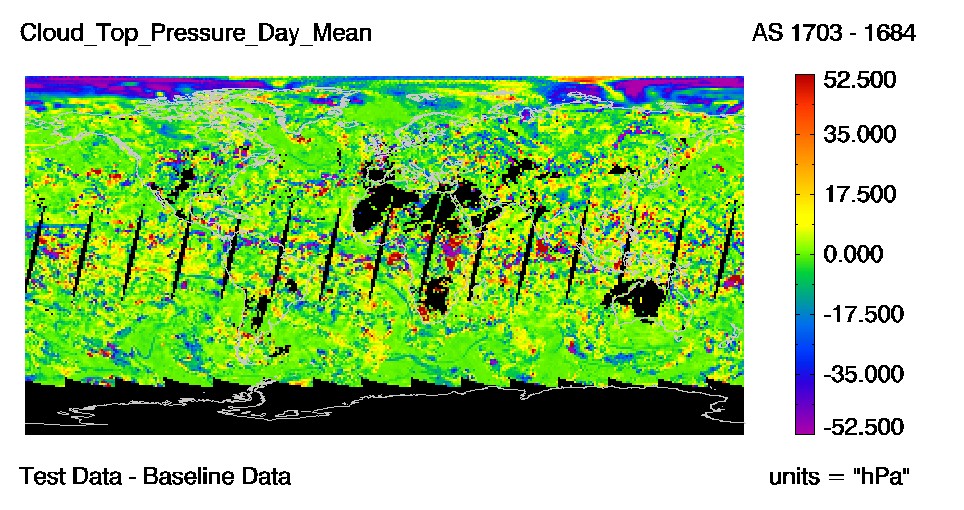
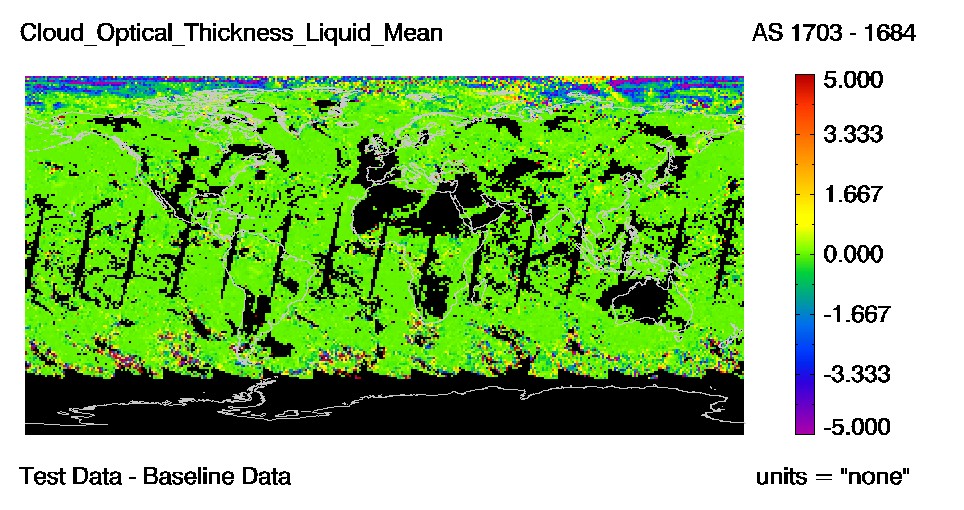
Figure. Shown are two difference images from Terra daily (MOD08_D3) for day 2019134. The test data used for these difference images were created using a new version of GDAS data and the baseline is the old version.
PGE Versions & Production Dates of Problematic Data:
Data Dates Affected: New GDAS Data was used to process starting on 12 June 2019 data.
Affected Platform: Terra & Aqua
Collections Affected: Collection 6.1 only
Additional Documentation:
Issue #12: Missing Data in 5km Cloud Top Property Parameters
Description: The MODIS Standard 06_L2 Cloud Top Property Retrieval algorithm is, very intermittently, producing fill (missing) data in regions where the Cloud Mask was valid and defined as cloudy -- meanwhile, in these same very limited regions, the Cloud Optical Property retrieval algorithm is producing valid data. This causes pixel count anomalies in downstream L3 products. It is expected that this aforementioned Cloud Top Property retrieval algorithm bug will be corrected in Collection 7, with an expected release date in the 2021/2022 timeframe.
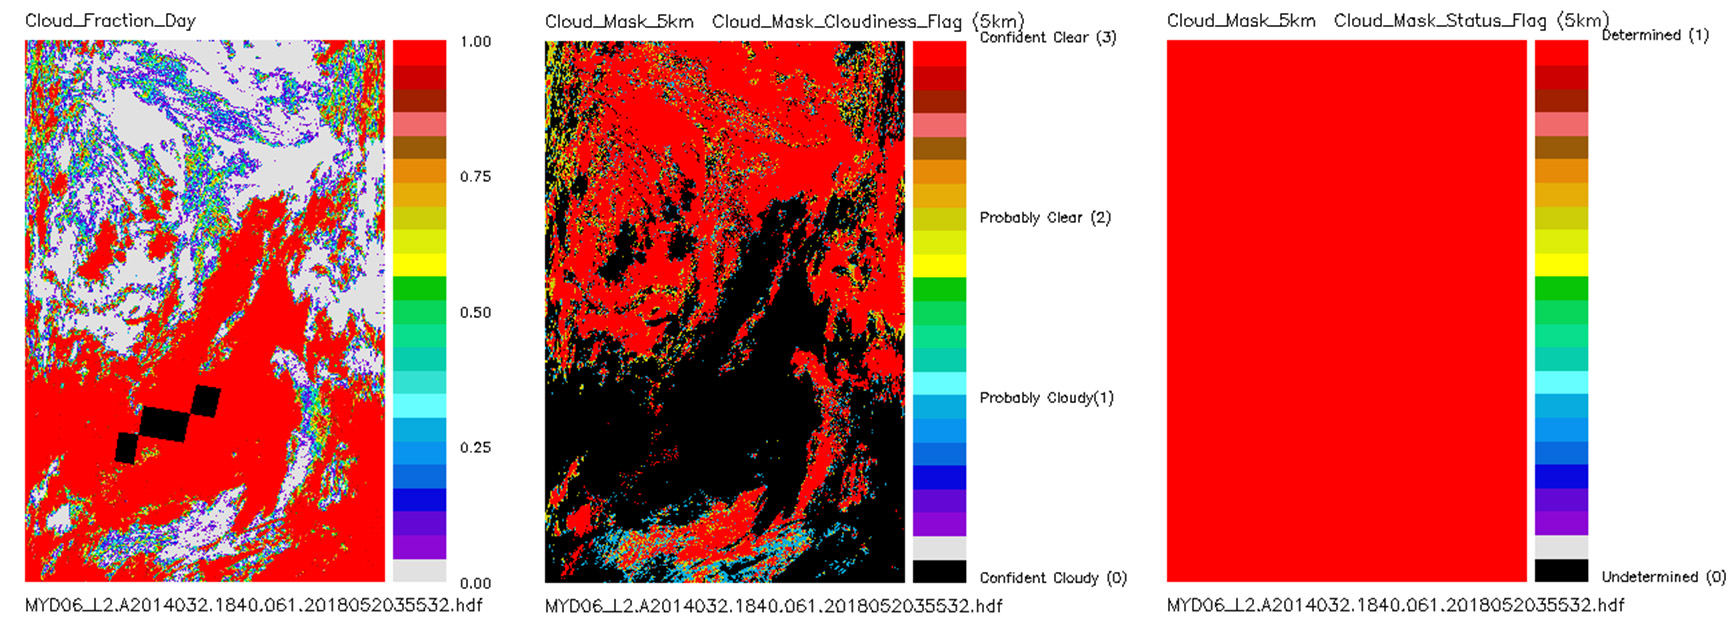
Figure. A depiction of the L2 5km Cloud_Fraction_Day SDS (showing missing data) vs. the L2 5km Cloud_Mask_Cloudiness_Flag and Cloud_Mask_Status_Flag (showing no issues, no missing data).
PGE Versions & Production Dates of Problematic Data:
Data Dates Affected: All C6.1 Data
Affected Platform: Terra & Aqua
Collections Affected: Collection 6.1 only
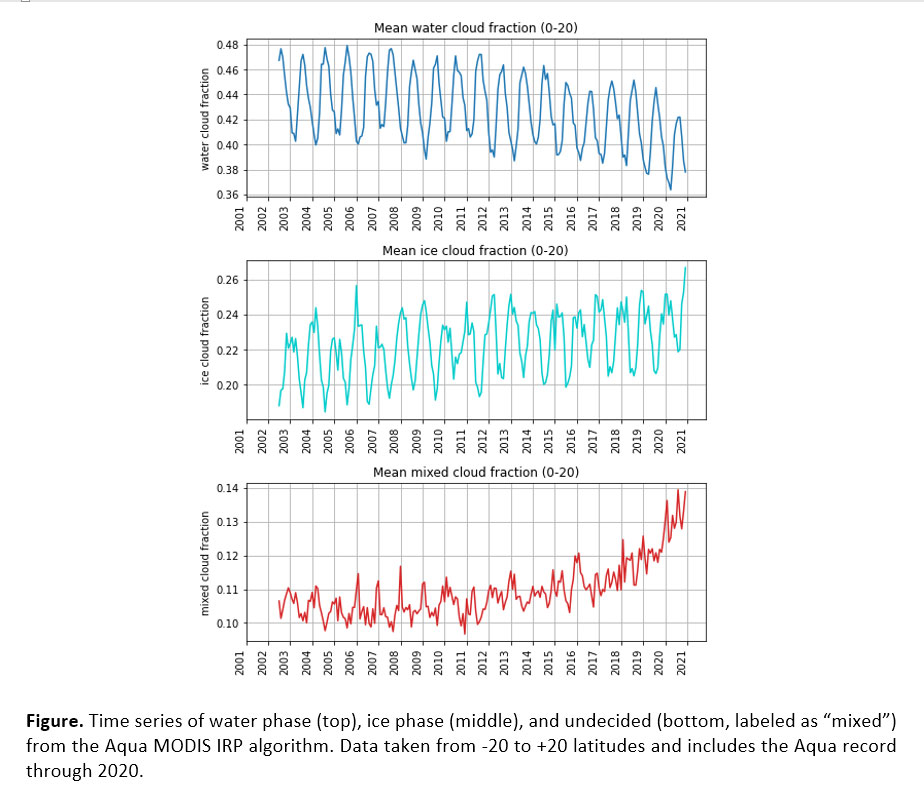
Issue #13: Artificial Trending Seen in Aqua MODIS Infrared Cloud Phase Parameters
Description: Time series of the 5-km spatial resolution Aqua MODIS Infrared Cloud Phase (IRP) product have revealed artificial trends in water, undecided, and ice phase retrievals. The IRP algorithm is part of the PGE06/MOD_PR06CT software suite. Cloud phase designations are computed by comparing observed 11 µm brightness temperatures (BTs) and 8.6-11 µm brightness temperature differences (BTDs) to preset, constant thresholds. Results are stored as histogram counts in 5-minute granule output and aggregated into daily and monthly totals. Monthly percents of ice phase, undecided, and water phase were calculated over the Aqua record and placed in time series plots (see figure).
The trends appear to be influenced by anomalous performance (warming) in the Aqua MODIS band 29 (8.6 µm) observations. As 8.6 µm BTs warm relative to 11 µm, the 8.6-11 µm BTDs become larger (more positive). Since water phase clouds generally have 8.6-11 µm BTDs < 0.0K, this leads to fewer water phase and more undecided and ice phase clouds as shown in the plots. The impact is greatest in the deep tropics (20S-20N) but is still apparent in the mid-latitudes. Impact in polar regions is small.
PGE Versions & Production Dates of Problematic Data:
Data Dates Affected: All C6.1 MODIS Aqua Data
Affected Platform: Aqua
Collections Affected: Collection 6.1 only
Issue #14: PWA Failure in Oct 2020 affecting high latitude data for CM and CTP
Description: Cloud Mask (CM) and Cloud Top Properties (CTP) Issues After Printed Wire Assembly (PWA) Failure on 5 October 2020. On October 5, 2020 at 15:21:12, Terra MODIS experienced a Printed Wire Assembly (PWA) failure that has caused an ongoing reduction and irregularity in the overall Terra MODIS daytime coverage over high latitudes in both hemispheres. In many polar and some subpolar sunlit scenes, L1B visible and near infrared (VNIR) reflectances are missing.
Degraded results are seen in both the cloud mask and cloud top properties outputs. During daytime, the cloud mask (MOD35_L2 in PGE03) uses the Normalized Difference Snow Index (NDSI) to determine if snow or ice is present on the Earth’s surface. The lack of reflectance data means that this quantity cannot be computed and the cloud mask assumes no snow or ice is present, leading to many false cloudy pixels. A fix for this problem has been submitted to MODAPS where mapped National Snow and Ice Data Center (NSIDC) NISE (Near-Real-Time SSM/I-SSMIS EASE-Grid Daily Global Ice Concentration and Snow Extent) data is substituted for the missing NDSI. NISE data inputs are used in the cloud mask for nighttime applications. In daytime cases where there is no actual snow or ice cover but L1B is missing VNIR reflectances, the cloud mask is degraded and is essentially an infrared-only mask (1.38 µm data is always available).
An issue is also seen in the MOD_PR06CT (5-km Cloud Top Properties) algorithm contained in PGE06. Daytime L1B scans that are missing VNIR reflectances are marked as “night”. Currently, day/night decisions are based on both solar zenith angle (SZA) and scan mode from L1B data. If the SZA > 85° or scan mode is “night”, then the data is defined as nighttime and the outputs sorted accordingly. This leads to incorrect day vs. night designations in both L2 and L3 outputs, including 5-km cloud fractions (aggregated from 1-km cloud mask data) and 5-km cloud top pressures. The 1-km cloud top properties are not impacted. A fix has been submitted to MODAPS where the day/night decision is made according to SZA alone.
Figure. The figure below shows resulting problems with L3 cloud fractions. The curves represent time series of daily mean 5-km cloud fractions taken from latitudes 70N-90N from 01 January to 21 May 2021. When daytime Terra L1B contains VNIR data, the agreement is good between Aqua and Terra cloud fractions (blue and green curves). Cloud fractions from sunlit regions but without Terra MODIS VNIR data are currently labeled as “night” and are included in the red trace. As the season advances, “nighttime” cloud fractions from Terra (red) and Aqua (black) diverge. Recall that the daytime Terra MODIS cloud mask is recording inappropriately large cloud amounts due to missing NDSI calculations and these large values are being aggregated into the nighttime L3 cloud fractions.
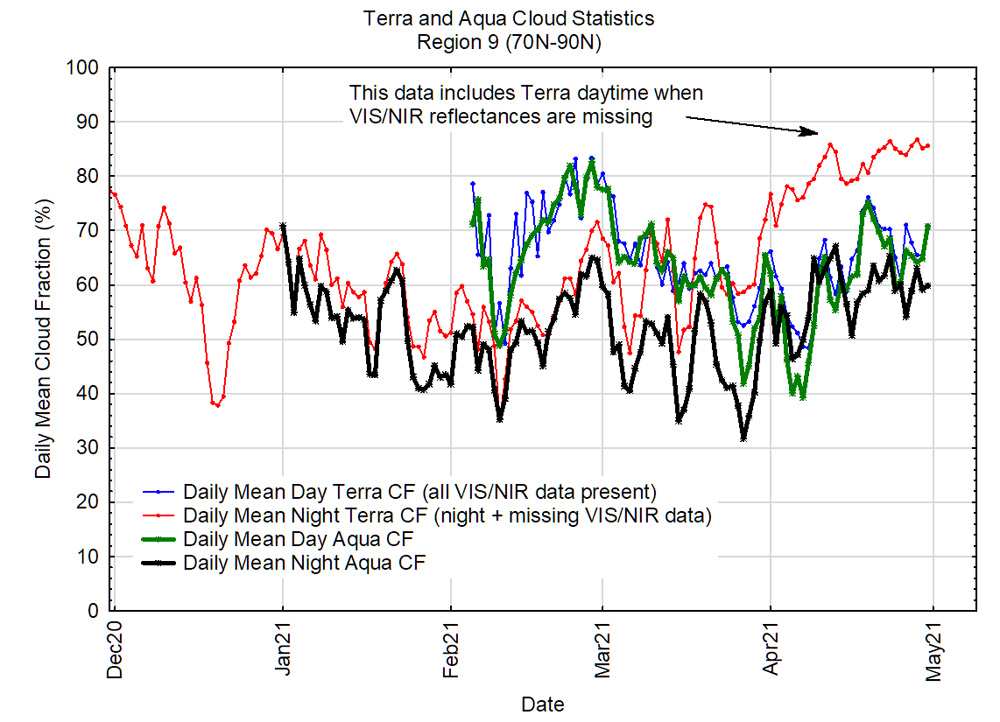
Figure. The figure below shows two difference images from Terra MODIS daily (MOD08_D3) for day 2021 137 (17 May 2021). The test data used for these difference images were created using a new version of PGE03 Cloud mask Algorithm and the baseline is the old version. As shown, the differences are primarily seen only over the higher latitudes.
PGE Versions & Production Dates of Problematic Data:
Data Dates Affected: Terra CM and CTP Data after 5 Oct 2020, but only in high latitude regions.
Affected Platform: Terra
Collections Affected: Collection 6.1
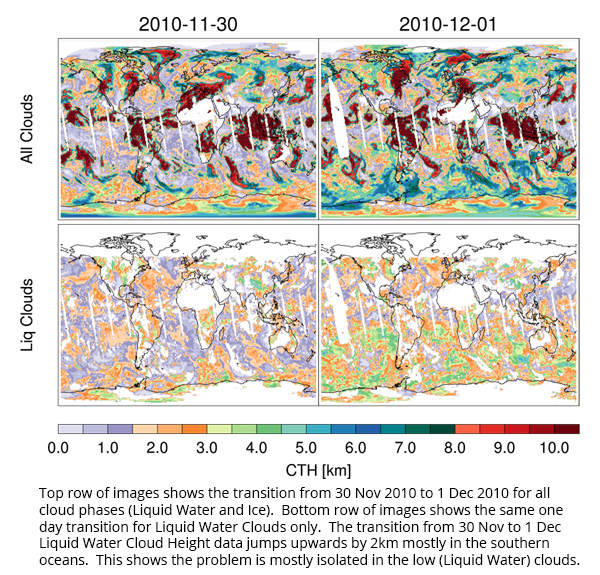
Issue #15: Isolated pixels of Cloud Top Height = 0.0 meters
Description: The Cloud Top Heights in the MOD06/MYD06 products are derived from mapping Cloud Top Pressure retrievals to heights using the GFS reanalysis Geopotential Heights. Even though there are Cloud Top Pressure data values in the 06_L2 data files it does not mean that all of the data are of good quality. For the 5km product one must look at the Qaulity_Assurance_5km product and decode bits 1-3 to this table of values:
0 = Fill
1 = Marginal Confidence
2 = Good Confidence (not currently used)
3 = Very Good Confidence
[Source: C6.1 QA Plan ]
Essentially, it's been found that all the high (warm) Cloud Top Pressure values that correspond to 0.0 meter Cloud Top Height correspond to pixels with ‘Marginal Confidence’.
It should be noted that there was no screening of L2 values by confidence flags in L3 (so no screening of marginal confidence in L3) -- so these unusual CTH values of 0.0 will show up in L3 data if ALL the subsampled L2 pixels in a given 1x1 degree L3 grid box had 0.0 meter CTH values Upon examination of actual C61 opterational data, it was found CTH=0.0 does occasionally occur in L3 Mean statistic SDSs, and certainly is very visible in the CTH Minimum statistic SDSs.
Data Dates Affected: All Dates
Affected Platform: Terra & Aqua
Collections Affected: Collection 6.0 and 6.1
Issue #16: Aqua Crosstalk Issue in Apr-Jul 2022 Data
Description: MODIS Aqua had a cross talk issue between 17 April and 26 July 2022, whose signature could be seen in cloud mask data and impacted some downstream Level-2 science products. The affected data was reprocessed in Nov-Dec 2022, correcting this issue. This reprocessed data addressed the drift in the cross-talk correction for the PV-LWIR bands 27-30 that was noticed after the Aqua MODIS instrument came back from the last S/C and instrument safe-mode that lasted between 2022-03-31 (DOY 090) and 2022-04-14 (DOY 104).
The same L1B LUTs that resolves this drift in the PV-LWIR cross-talk, have been operational in the C61 forward processing stream, starting DOY 2022-208 (2022-07-27). The main impact from this cross-talk update is expected to be on the cloud and water vapor Atmosphere products. The MYD21 LST product is also expected to show differences of up to 0.5-1K, mainly over the vegetated areas. Users are requested to take note of this and start using the reprocessed versions of these products for any future studies. Users should make sure the production dates for these files used for their science and research have production dates after 1 November 2022 (day 305)
Data Dates Affected: 17 April 2022 through 26 July 2022
Affected Platform: Aqua
Collections Affected: Collection 6.1
Quality Statement #1: Discontinuity in Collection 6 Aqua Data July 2016 and later
 Description: A step function discontinuity (of about 1 to 2%) has been noted in the Collection 6 (006 or C6) Level-1B (L1B) input calibrated radiance data for MODIS Aqua data starting in July 2016 (moving forward), which impacts the downstream C6 MODIS Atmosphere Level-2 (L2) and Level-3 (L3) MODIS Aqua data. This discontinuity should be noted by data users -- and will be fixed when the Aqua data dates from launch (July 2002) through June 2016 are reprocessed to Collection 6.1. This Collection 6.1 (061 or C61) reprocessing will remove this few percent step function discontinuity. Data users of MODIS Aqua Data for all Level-2 (L2) and Level-3 (L3) Daily atmosphere products should be aware of this step function discontinuity and replace their Collection 006 data with the new Collection 061 Aqua data, which was completely reprocessed and released to the public in early March 2018.
Guidance to Users: Users should note there is step function discontinuity of a percent or two starting in July 2016 for all MODIS Atmosphere Aqua data products. This step function discontinuity was fixed with the Collection 6.1 (061) Aqua reprocessing, so users should replace all C6 Aqua data with C6.1 Aqua data (which is now available for the full record).
Data Dates Affected: 1 July 2016 (Day 183) and forward -- a data discontinuity of a few percent will be noted.
Affected Platform: Aqua Only
Collections Affected: Collection 6.0
Quality Statement #2: Missing Terra Data Granules between 5 Aug 2017 and 6 Aug 2017
Description: Following the Terra Deep Space Calibration on August 5th, 2017 (2017 217) there were some faulty C6 Terra MODIS Atmosphere data as the focal plane temperatures did not return to nominal values until the day after - August 6th, 2017 (2017 218) 1420 UTC. So the granules for the time period between 2017 217 23:00 UTC and 2017 218 14:15 UTC were removed before the downstream Atmosphere processing. Data users will notice missing MODIS Atmosphere Data during this period for all Level-2 (L2) and Level-3 (L3) Daily atmosphere products.
Here is a sample L3 animation of Liquid Water Cloud Optical Thickness for 6 Aug 2017, which shows the missing data issue fairly clearly. The animation loops between the C6.0 data and the C6.1 data. The C6.1 data is improved showing less missing data, however a gap still exists in C6.1
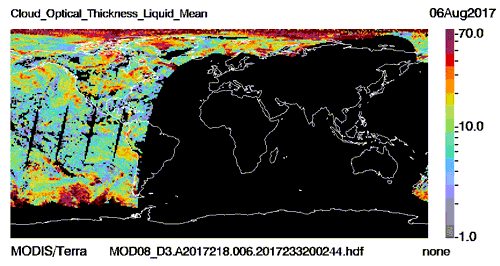
C6.0 vs C6.1 comparison of missing data gap (slight improvement shown in C6.1)
Data Dates Affected: Note there will be Missing Terra Data between 2017 217 (5 Aug 2017) at 23:00 UTC and 2017 218 (6 Aug 2017) at 14:15 UTC for all MODIS Atmosphere L2 and L3 Daily products.
Affected Platform: Terra Only
Collections Affected: Collection 6.0 and Collection 6.1 (note slightly improved in C6.1, about 50% less missing data, but still some missing)
Quality Statement #3: Data Quality Statement for the Level-2 5-km and 1-km Cloud Top Property Products
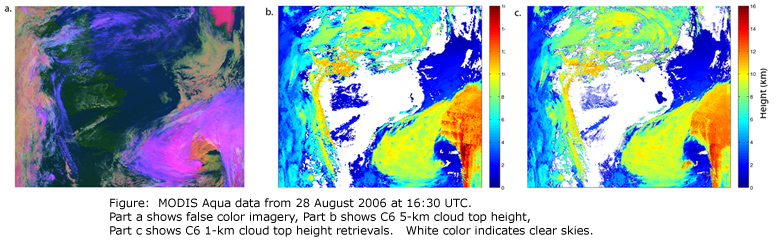
Description: For C6 a number of updates and improvements were made to the cloud top property products (cloud top pressure, height, temperature and cloud effective emissivity) and are documented extensively in Menzel et al. [2008, J. Appl. Meteor. Climatol., 47, 1175-1198]. In C5 and earlier versions, these parameters were available only at 5-km spatial resolution. In C6, these parameters are now available for the first time at the same 1-km resolution as the cloud optical and microphysical properties. The figure below provides an example Aqua MODIS granule from 28 August 2006 at 1630 UTC. A false color image is shown in (a), the 5-km cloud top heights in (b) and 1-km cloud top heights in (c). The 1-km product more accurately captures the broken low cloud field seen near the center of the image. Also note the linear structure in the comma-shaped cloud feature of a mid-latitude storm (lower right) that is easily seen in both products but is not obvious in the false color image. This striping, seen in the highest cloud top retrievals, is caused by mismatches between observed radiances and the 1-degree resolution NWP model profiles of temperature, moisture, and ozone that are necessary inputs to the CO2-slicing algorithm. Additional information, including comparisons of C6 cloud top heights to those derived from the CALIOP lidar, are available in Baum et al. [2012, J. Appl. Meteor. Climatol., 51, 1145-1163].
Guidance for Users: The updated (C6) 5-km and new (in C6) 1-km cloud top property products underwent extensive testing and evaluation, and are expected to be of better quality than the C5 products. Users should choose between the 1-km and 5-km products based on individual needs. For example, the 1-km product is best if finer spatial resolution is a paramount concern. The 5-km version is suggested for comparisons with heritage data such as HIRS. Note that the 5-km product generally exhibits higher signal to noise characteristics, i.e., more spatially consistent retrievals when clear-sky minus cloudy-sky radiance differences are very small. Users should be aware that the aggregated cloud top property parameters (and associated histograms) in the 08_D3/E3/M3 daily/eight-day/monthly global gridded Level-3 products are currently based on the 5-km Level-2 products.
Data Dates Affected: All Data Dates
Affected Platform: Aqua and Terra
Collections Affected: Collection 6.0 and Collection 6.1
Quality Statement #4: Data Quality Statement for the Level-2 1-km and 5-km Infrared (IR) Cloud Phase
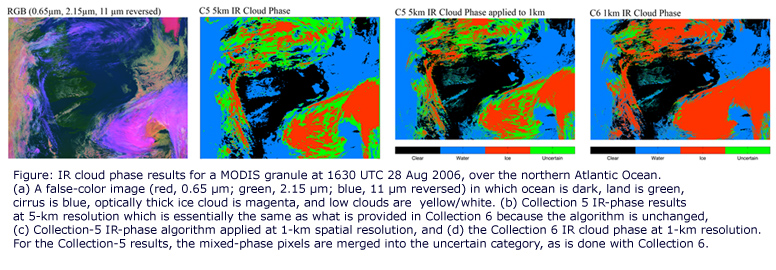
Description: For C6 a number of updates and improvements were made to the IR cloud phase that are documented extensively in Baum et al. [2012, J. Appl. Meteor. Climatol., 51, 1145-1163]. In C5 and earlier versions, this parameter was available only at 5-km spatial resolution; in C6, it is now available for the first time at the same 1-km resolution as the cloud optical and microphysical properties. However, instead of replacing the existing 5-km IR phase product with the new 1-km version, the algorithm development team decided to maintain in C6 a version of the 5-km product for continuity with C5. Users should be aware that the processing framework changed significantly for the 1-km IR phase retrieval. Because the older framework for the 5-km phase retrieval could not be easily modified without a complete rewrite, among other constraints, algorithm development and evaluation focused instead on the 1-km products. Differences between the 1-km and 5-km products should be expected. The cloud phase figure provides an example Aqua MODIS granule (28 August 2006, 1630 UTC; false color image in upper left panel) for which the 1-km and 5-km IR cloud phase products significantly diverge; the discrimination of optically thin cirrus as being of ice phase is improved significantly in the 1-km retrievals over that in the 5-km retrievals.
Guidance for Users: The new (in C6) 1-km IR cloud phase underwent extensive testing and evaluation through comparison with CALIPSO/CALIOP products, and is expected to be of better quality than the heritage 5-km products. Furthermore, it is likely that the 1-km and 5-km products will continue to diverge as further improvements to the 1-km products are made over time. Users are thus advised to use the 1-km IR phase product both now and in the future. Users should also be aware that the aggregated IR cloud phase (and associated histograms) in the 08_D3/E3/M3 daily/eight-day/monthly global gridded Level-3 products are currently based on the 5-km Level-2 products.
Data Dates Affected: All data dates
Affected Platform: Aqua and Terra
Collections Affected: Collection 6.0 and Collection 6.1
Quality Statement #5: Start Time of 06_L2 Granule Files
A MODIS Data User Posed this Question:
I was browsing through your “MODIS Atmosphere L3 Gridded Product Algorithm Theoretical Basis Document.” It says that “Each L2 MODIS granule (stored in a single HDF file) contains 5 minutes of data. The time stamp (which is part of the HDF file name) shows the start of the 5-minute data collection period. For example, a L2 MODIS granule (contained within a single HDF file) might have a time stamp of 1430. This means the start time of data acquisition was 14:30:00 UTC. The subsequent HDF granule would have a time stamp of 1435, which corresponds to an acquisition start time of 14:35:00 UTC. I checked with one MODIS granule (MYD06_L2.A2016214.2000.006.2016215165001.hdf). I found the scan starting time was 20h00m9.7s., very close to 2000. I suppose that the timestamp could departure a little from the real scan-start-time stored in L2 cloud data. I just want to know if I understood correctly. And what is the maximum difference between the timestamp in the file name and the true starting time. This will help us to collocate MODIS and CALIPSO/CloudSat data.
Answer from Geolocation expert:
I checked with our geolocation expert, Gary Lin, who suggested that the Geolocation product (MYD03) for this particular MYD06_L2 file is the appropriate source for the start-time. The Geolocation product defines an EV (Earth-View) Start Time, which is the same as the Scan Start Time in the MYD06_L2 file. The value of the EV Start Time is defined as 7.44235209736068E8, which is in seconds. Bottom-line, you need to account for the leap-second adjustment (from 1/1/1993). Also, do bear in mind that the EV Start Time in the Geolocation product (MYD03) is in TAI (International Atomic Time), while the time increment in the file-name is in UTC. In case the MODIS Level-1B User Guide and ATBD prove useful, here are their URLs:
More Information on Leap Seconds:
The upshot is there ere are 9 leap seconds from 1/1/1993 to DOY 214 in 2016.
Follow up Question from MODIS Data User:
Do I understand correctly that this confirms that the timestamp on the granule file name indeed is the starting time of the first scan within an error less than 1 second? If so, this will help to simplify the problem of collocation of Aqua MODIS with CALIPSO/CloudSat. I didn’t consider 9 leap seconds from 1/1/1993 to DOY 214 in 2016. And the result shows a difference of 9.7 seconds. Seems the problem is resolved.
Answer from Geolocation expert:
I have confirmed with Gary Lin that the timestamp in the granule’s file-name is indeed the starting time of the first scan within an error of ~1.5 seconds.